Release 0.4.1 powered by heart zone metrics!
New release of runpandas comes with heart training zone metrics and minor changes to the CI build actions.


This current state of the project is
early beta, which means that features can be added, removed or changed in backwards incompatible ways.
We published this minor release with some new metrics and changes to better improve our build process. In this release of RunPandas 0.4.1, we include:
- The Activity now provides some special methods in
runpandas.acessorsthat computes the heart training zones for each record and the time spent for each training zone. - We published for the first time our package to the Anaconda scientific package repository.
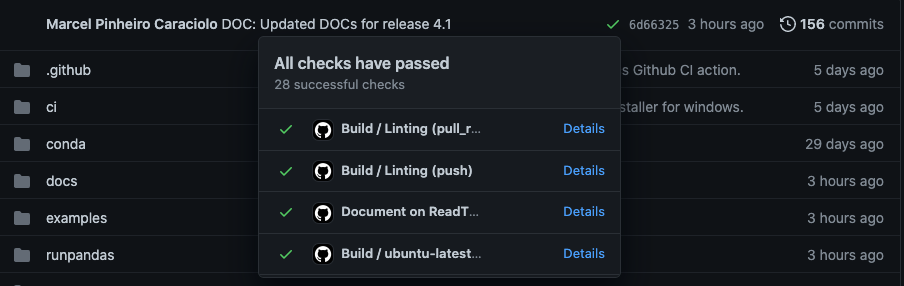
- Finally, we have changed our CI build implementation from Travis CI to Github actions. Unfortunately, the Travis CI became highly limited to open-source projects, which resulted into several builds to not run anymore due to lack of credits.
Runpandas is a python package based on pandas data analysis library, that makes it easier to perform data analysis from your running sessions stored at tracking files from cellphones and GPS smartwatches or social sports applications such as Strava, MapMyRUn, NikeRunClub, etc. It is designed to enable reading, transforming and running metrics analytics from several tracking files and apps.
Now runpandas comes with useful methods to data runners who desires to explore their heart rate data and check the heart rate range variation and the respective training zones or the time ellapsed through each training zone during the workout.
#Disable Warnings for a better visualization
import warnings
warnings.filterwarnings('ignore')
import runpandas
activity = runpandas.read_file('./data/11km.tcx')
print('Start', activity.index[0],'End:', activity.index[-1])
print(activity.iloc[0]['lat'], activity.iloc[-1]['lat'])
First, let's perform a QC evaluation on the data, to check if there's any invalid or missing data required for the analysis. As you can see in the cell below, there are 5 records with heart rate data missing. We will replace all these with the first HR sensor data available.
import numpy as np

group_hr = activity['hr'].isnull().sum()
print("There are nan records: %d" % group_hr)

#There is 5 missing values in HR. Let's see the positions where they are placed in the frame.
print(activity[activity['hr'].isnull()])

#We will replace all NaN values with the first HR sensor data available
activity['hr'].fillna(activity.iloc[5]['hr'], inplace=True)

print('Total nan after fill:', activity['hr'].isnull().sum())
Let's see how to add a column with the heart rate zone label to the data frame. For this task, we will use the special method runpandas.compute.heart_zone . The parameters are the bins argument which contains the left and right bounds for each training zone and the labels argument corresponding to the zone labels
activity['heartrate_zone'] = activity.compute.heart_zone(
                        labels=["Rest", "Z1", "Z2", "Z3", "Z4", "Z5"],
                    bins=[0, 92, 110, 129, 147, 166, 184])
activity["heartrate_zone"].tail()
To calculate the time in zone, there is also a special method runpandas.compute.time_in_zone which computes the time spent for each training zone.
time_in_zone = activity.compute.time_in_zone(
                        labels=["Rest", "Z1", "Z2", "Z3", "Z4", "Z5"],
                    bins=[0, 92, 110, 129, 147, 166, 184])

time_in_zone
We decided to publish our runpandas packages at one of the most popular pythonic scientific package repositories : Anaconda . There are more millions data science packages published focusing on scientific areas. In this release we published at the owner's package repository (https://anaconda.org/marcelcaraciolo/runpandas), but the goal is to publish it at the conda-forge main repository. We will work on this task to submit our package as a release candidate.
Since last year the CI/CD provider TravisCI started to put several limitations to their free tier quotes , specially to open-source projects with had a specific ammount of time-credits for builds. We understood that for them it was a big decision , because building open source products and maintain them is extremely difficult. Since runpandas is a fully open source package, I decided to find other CI provider.
Github Actions came to the rescue, since it remains free for any open-source project hosted in Github. Finally, I moved in this release all the build scripts to the Github actions.
The next releases will come with power metrics and support to the workout summary visualization. So stay tunned!
We are constantly developing Runpandas improving its existing features and adding new ones. We will be glad to hear from you about what you like or don’t like, what features you may wish to see in upcoming releases. Please feel free to contact us.